Wekinator is a software tool designed for interactive machine learning, particularly in the context of real-time multimedia applications. It was developed by Rebecca Fiebrink as part of her doctoral research and provides a user-friendly interface for artists, musicians, designers, and researchers to create custom machine learning models without requiring extensive programming knowledge. Wekinator is commonly used in the fields of creative coding, music composition, interactive installations, and more.
At its core, Wekinator enables users to train machine learning models that can recognize patterns and correlations in data, and then use these models to map input data to desired output responses. This process is often referred to as “machine learning for gestural interaction” because it allows users to train models using gestures, movements, audio, or any other type of data input. These models can then be applied in real-time to control various aspects of multimedia applications, such as generating sound, altering visuals, or even controlling physical devices.
Getting started
- Start with Downloading Wekinator.
- Follow the Walkthrough guide see also video below
If you download wekinator example files from: https://github.com/airlabitu/Tutorials/tree/master/Wekinator_examples you can play around using different input and output examples.
Using wekinator in your project
Develop your own projects with Wekinator. The detailed instructions guide will teach you what you need to know about Wekinator to implement the software into your project.
Trying the classifier explorer
A good place to start learning about machine learning is trying out the classifier explorer example.
Download wekinator files from: https://github.com/airlabitu/Tutorials/tree/master/Wekinator_examples
Open the ClassifierExplorer.pde file in proccesing. Run the file.
Open wekinator and create a new project with these settings:
Wekinator setup
- OSC listening: 6448
- OSC output: 12000
- 2 inputs
- 1 classifier output
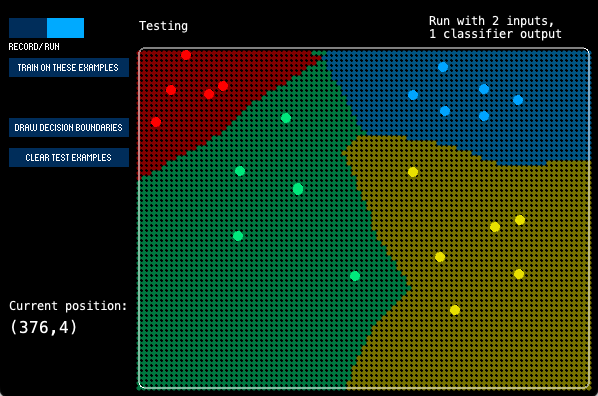
Now you will be able to input (x,y) data with specific classes.
Use mouse click to create a dot on the map. Use any number key to change class (color).
Switch from record to run, press “train on these examples” and then “Draw decision boundries”.
This visualises how the algorithm that the machine learning has created. You can now see on the map what it would classify any (x,y) coordinate.