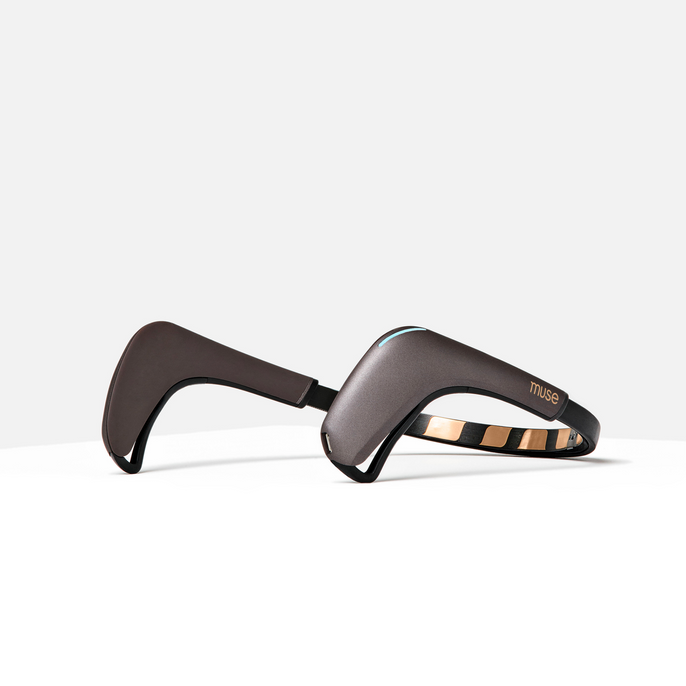
Muse S is a commercial brainwave scanner developed for meditation, sleeping etc.
In AIR lab we use Muse 2 and Muse S for two scenarios.
- EEG and other raw data: EEG, PPG, Acceleromer, Gyroscope and Temperature sensor.
- Brainwaves (Alpha, Beta, Delta, Gamma & Theta).
We have written a tutorial for each of these, that you can find below this paragraph. If you dont know which one to choose, see our explanation of the two fundamental concepts that are essential for leveraging Muse effectively: EEG and brainwaves. Understanding these will not only enhance your experience with Muse but also enable you to make an informed decision about which part of the tutorial to focus on based on your interests and needs. See this detail at the bottom of this page.
1. EEG and other raw data – Tutorial
The Muse consists of more than just EEG sensors, it also contains, PPG Sensors: Photoplethysmography sensors are used to measure heart rate by detecting blood volume changes in the microvascular bed of tissue. Accelerometer: This sensor measures the movement of the head. It helps in detecting and analyzing head movements. Gyroscope: The gyroscope detects head orientation. Temperature Sensor: Available in some models like the Muse S, this sensor measures the temperature of the skin.
Follow this guide to acces all the raw data from the Muse.
See our tutorial for using Muse to track EEG and other raw data here.
2. Brainwaves (Alpha, Beta, Delta, Gamma & Theta) – Tutorial
This guide uses the “Mind monitor app” a app, that procces and filters the raw EEG for you, turning it into Brainwaves data, making it simpler and easier to interpet the brain data. By using the “Mind Monitor app” you dont gain acces to the raw data of the Muse.
See our tutorial for using Muse to track Brainwaves here.
The two fundamental concepts EEG and brainwaves
EEG stands for Electroencephalography, a method used to record the electrical activity of the brain. It involves the use of sensors placed on the scalp that detect tiny electrical charges resulting from the activity of brain cells. Raw EEG data refers to the direct readings from EEG sensors before any processing or filtering to extract specific signal features like brainwaves. This data is essentially a complex waveform showing the electrical activity generated by the brain, and it includes a mix of all the different frequency bands (delta, theta, alpha, beta, gamma) plus noise and artifacts from other sources (like muscle movements or electronic devices). Here are some uses of raw EEG data: Research, Brain-Computer Interfaces (BCIs) and more.
Brainwaves are the patterns of electrical activity occurring in the brain. These patterns are commonly categorized into five types based on their frequency ranges: Delta, Theta, Alpha, Beta, and Gamma. Each type of brainwave is associated with different mental states, from deep sleep (Delta) to high alertness (Gamma). Brainwaves data refers to EEG data that has been processed to filter out specific frequency bands associated with different mental states. This data is more accessible and interpretable for most users, and it has several practical applications: Mental State Monitoring, Meditation and Mindfulness Training, Educational Tools and Learning, Sleep Analysis and more.
Both raw EEG data and brainwaves data originate from the same source—the electrical activity of the brain measured by EEG. However, the ways in which they are used are distinct due to differences in how the data is presented and interpreted. Let’s explore why they might not always be interchangeable, even though they contain fundamentally the same underlying data.
Raw EEG data is essentially a raw signal that contains all frequencies mixed together along with noise and other artifacts. This data:
Is complex and high-dimensional, requiring specialized knowledge and tools to analyze effectively. It includes all the nuances of the electrical activity across the brain.
Needs processing to remove noise and artifacts, which might be muscle movements, eye blinks, or external electromagnetic interference.
Provides a comprehensive view, which is particularly important in clinical and research settings where detailed information is necessary for diagnosis or understanding specific brain activity.
Brainwaves data, on the other hand, has been processed to isolate specific frequency bands (delta, theta, alpha, beta, gamma) from the raw EEG signals. This data:
Is simpler and more focused, making it easier for non-specialists to understand and use.
Has been filtered and often averaged, which means it highlights general trends rather than detailed, moment-to-moment fluctuations in brain activity.
Is tailored for specific applications, such as meditation or cognitive performance tracking, where understanding broad patterns of brain activity (like relaxation or alertness) is more relevant than detailed electrical patterns.
Now that you have a foundational understanding of EEG and brainwaves, you can choose the section of the tutorial that best matches your goals and interests: